Service use
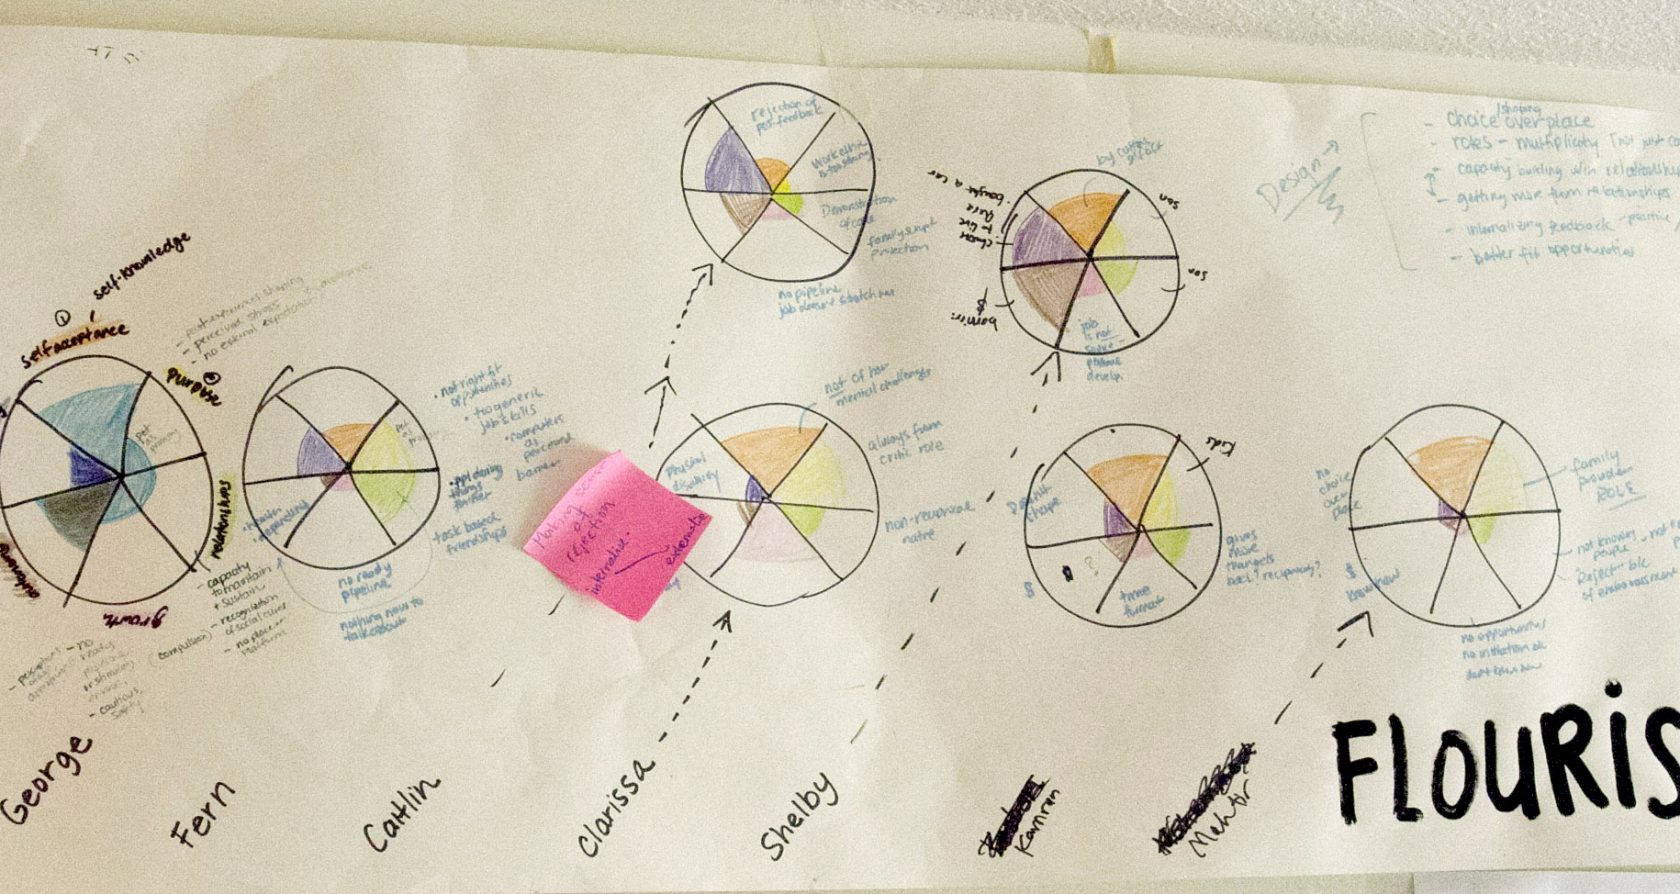
Stressors
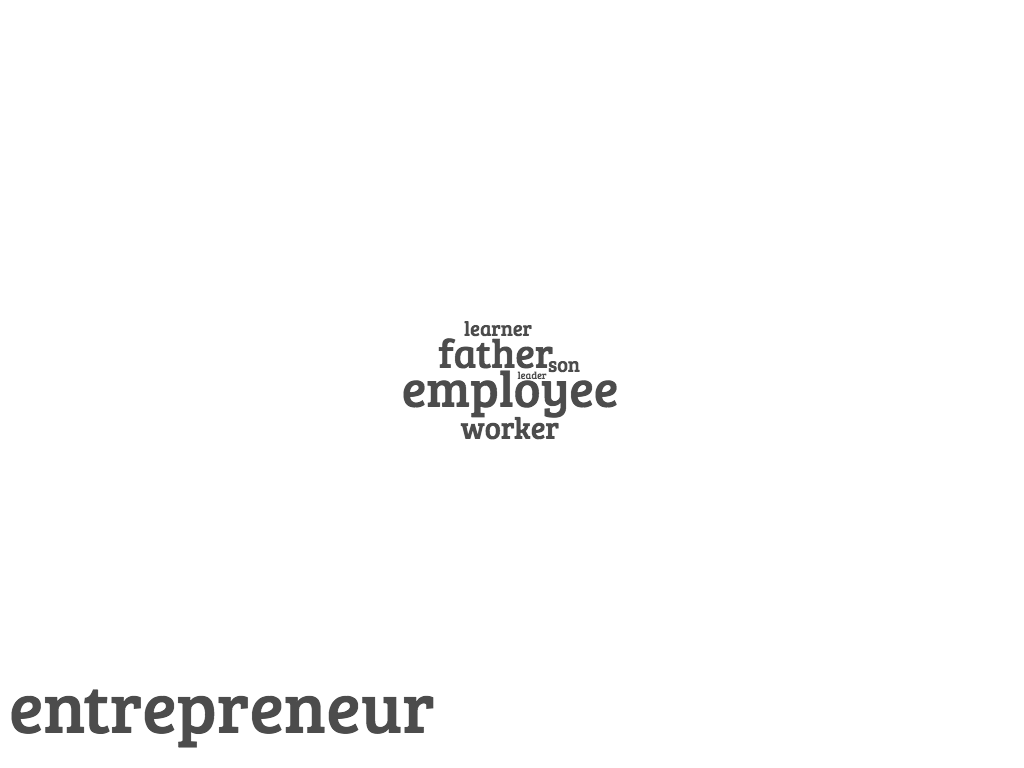
Roles
aspired roles
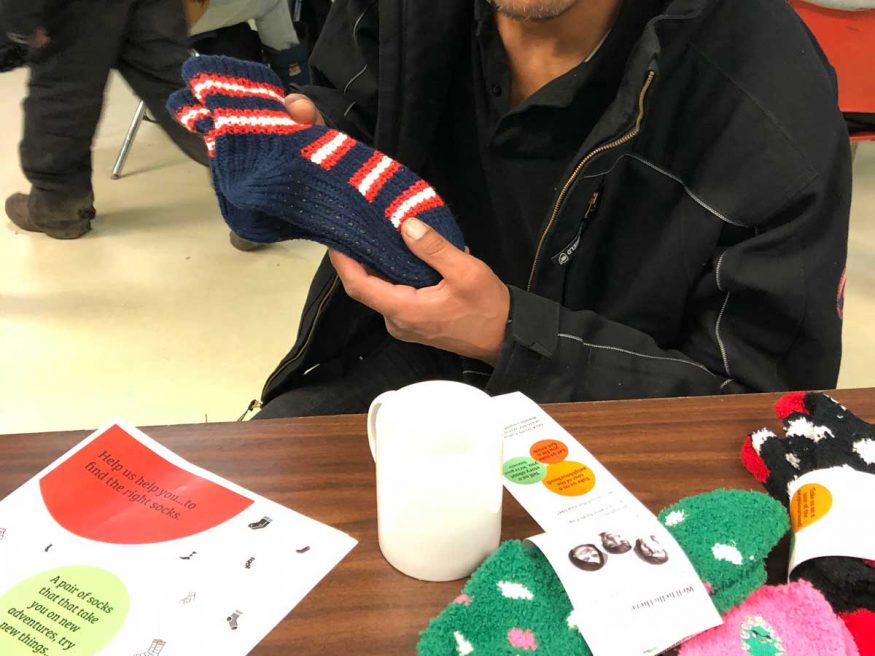
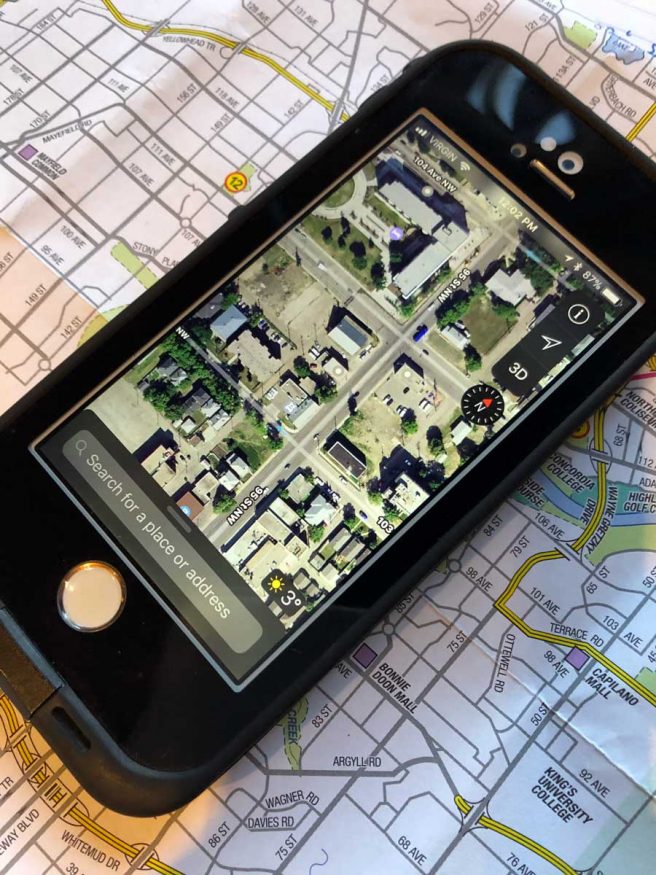
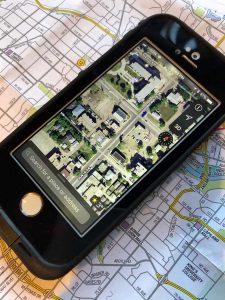
Places
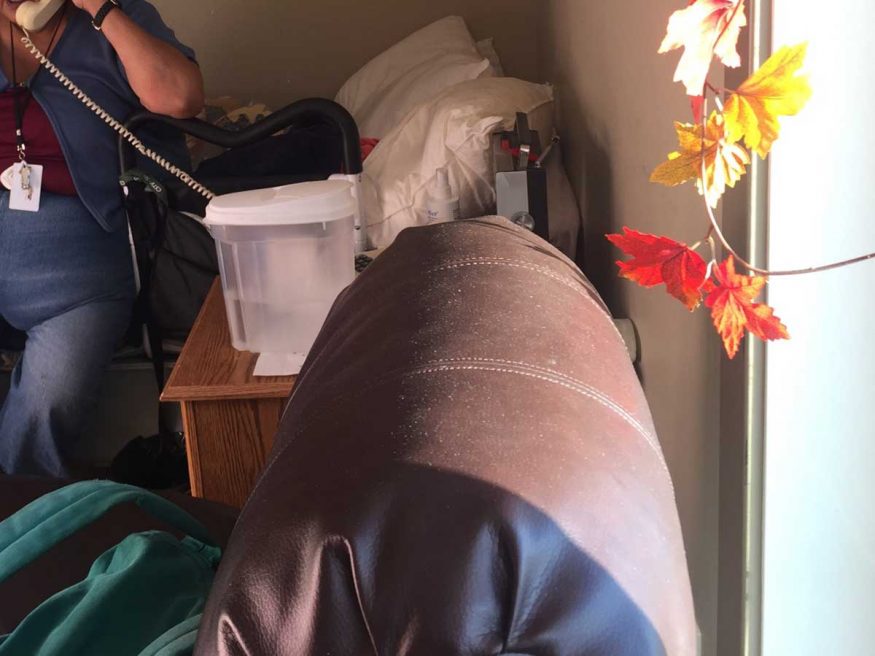
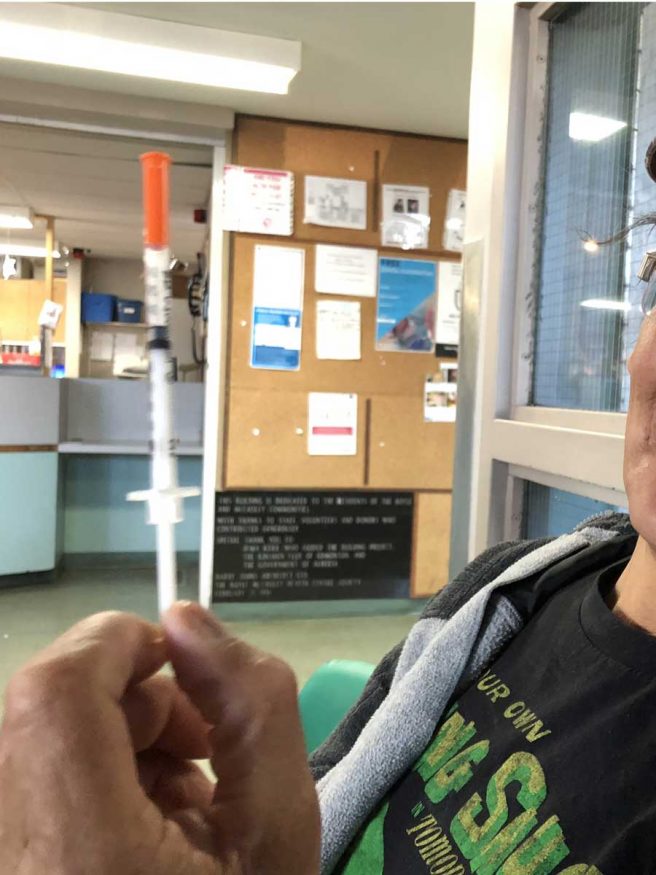
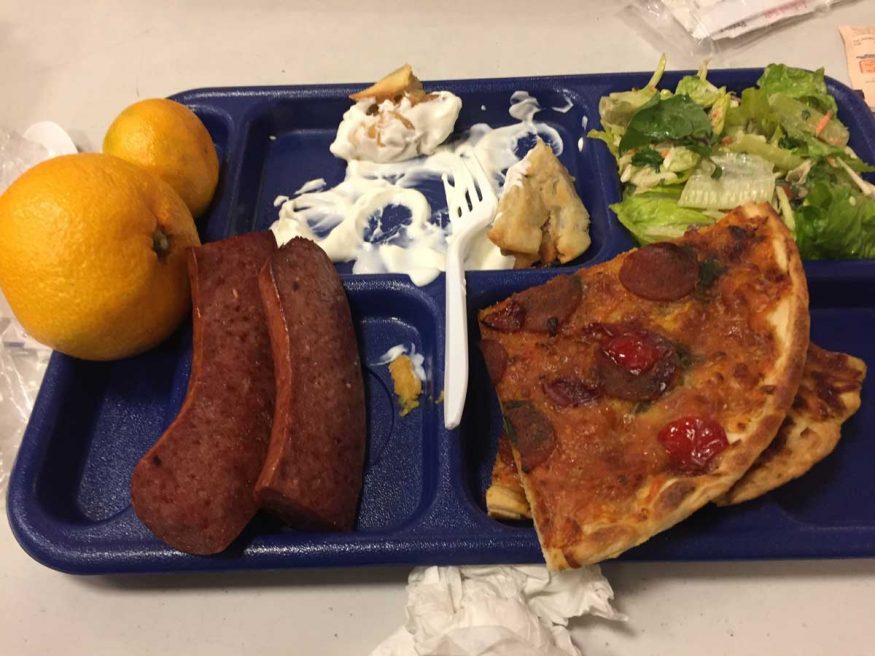
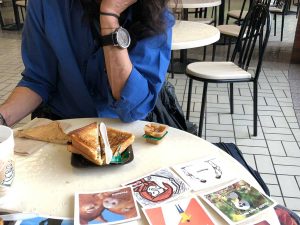
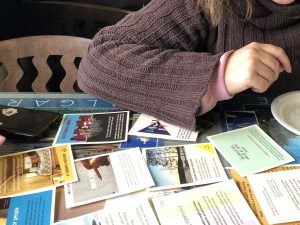
Photos
> people
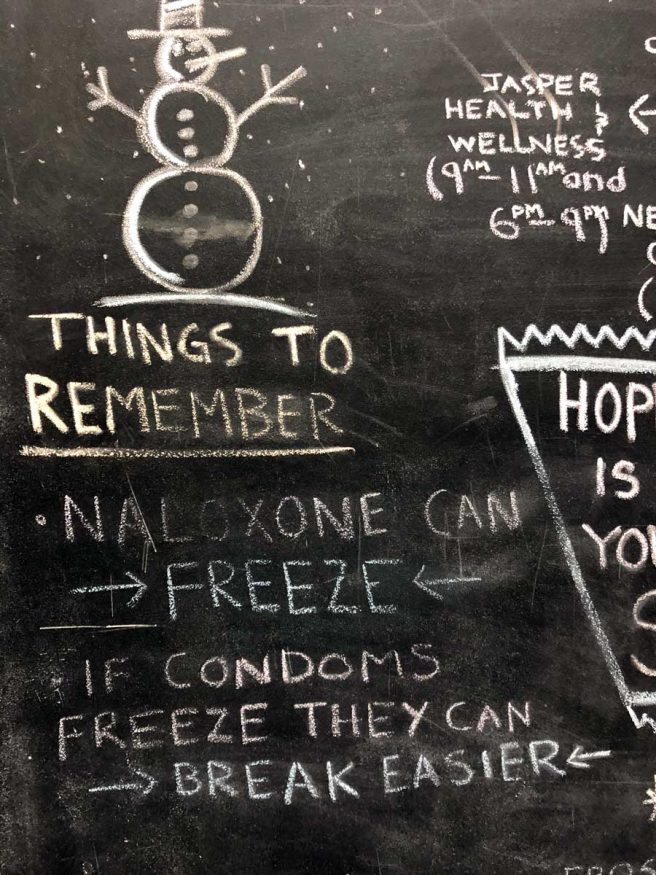
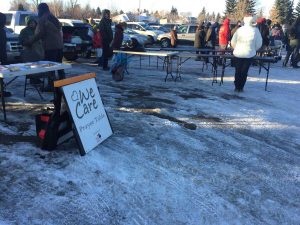
> services
> places
> other tags


I’ve tried to test several kinds of visualizations to explore possibilities for different kinds of data — and what we can already get out of the existing, free Google suite. Some graphs still required manual work to reshape the format of the data — eventually we can likely eliminate most of that.
This is a first ‘implementation’ prototype for Grounded Data, using the data from the Edmonton ethnographies. With Grounded Data we’re hoping to make progress on several areas:
- get more out of the thick data we collect with ethnographies
- create ways into the (more dense) individual stories
- make ethnographic data useful for different groups of people
- formalise the process of data collection and synthesis, so a larger group of people can do it
- collect data that’s comparable between sets