Categories
Just a recap: Grounded Space is a collective of social service agencies who are building their own Research & Development teams so that innovation can be a sustained practice, not a one-off project. Embedded Researchers are front-line & mid-level staff who anchor internal R&D teams.
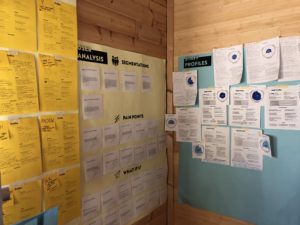
1. Setting up the space from three perspectives
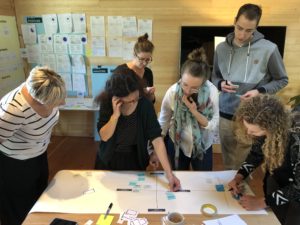
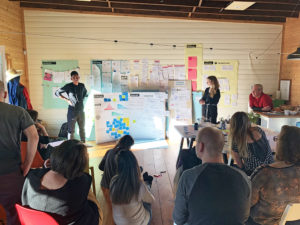
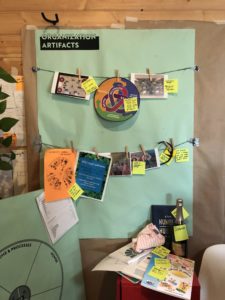
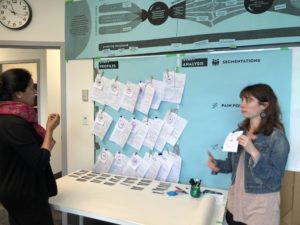
One of the most important features of Grounded Space is co-designing from three perspectives: end users, staff, and the organization/eco-system. We’ve often found user-centred design can focus on one stakeholder group at the exclusion of others. So we’re trying to coach teams to do ethnographic work from multiple vantage points, and find the common pain points and opportunity spaces.
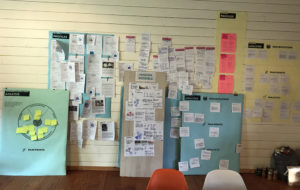
Color-coding was one simple technique we modeled to help teams visually recognize and organize information by each user group. Yellow for the user, where we laid out the user profiles, segments, pain points, and ‘what ifs’ that came out from the previous analysis sprint. Blue for staff, where we created profiles of the frontline workers interviewed and observation summaries. Green for the organization, where teams put up the artifacts that represented their culture and highlighted core strategic messages.
2. The staff perspective: finding segments & pain points
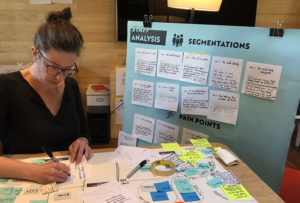
Teams then learned how to find patterns from their user & staff profiles. They practiced using social science constructs (e.g self-efficacy, intrinsic vs. extrinsic motivation, level of support, perceived hierarchy) to surface segments. A segment is a group of people with similar needs, wants, and motivations. Because sense-making is exploratory (versus for validation), we encouraged teams to try lots of possible groupings to see what was most revealing.
Once a group of people with commonalities was found, teams gave each a name to capture the main insight. For example, ‘the comfortably resigned’ referred to a group of staff comfortable with routine, who knew things could be different, but had come to accept the status quo. It was just easier that way. Their pain point was they felt unheard and because their past ideas had not been acknowledged, they stopped offering suggestions.
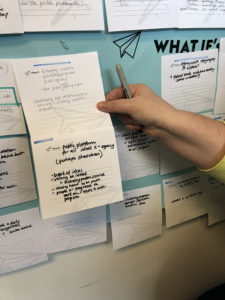
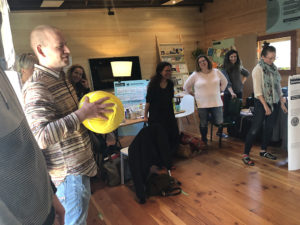
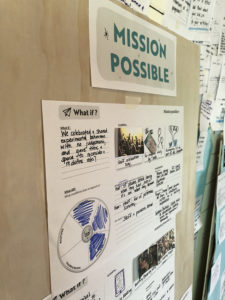
Next, we turned each pain point into a ‘what if’ question to address the underlying frustration and hurt. To build on each other’s ideas and spark creativity, we played a generative ball game. For example, what if … there was no such thing as a no? What if … there was a ‘fuck yes’ week? These ideas responded to a segment of staff and users who felt stuck in a routine and constrained to try new things.
What new things are staff already trying?
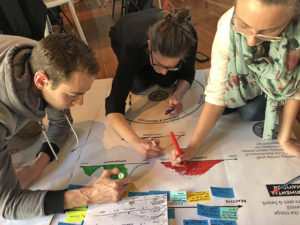
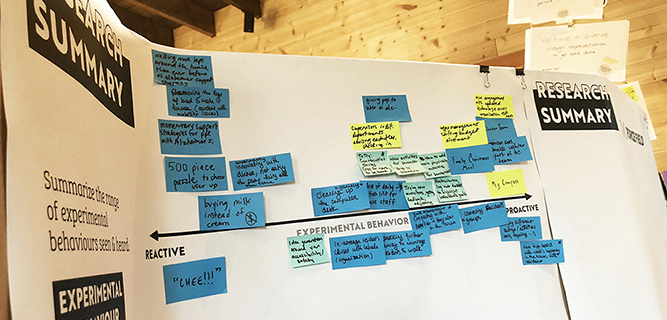
Since the goal of Grounded Space is to understand & amplify conditions for experimentation, we didn’t just want to focus on pain points for experimentation. We also wanted to map where experimental behaviours were already occurring. Teams named each experimental behavior they heard or witnessed during the research and placed them on a continuum from those that were reactive (as a response to an unanticipated event eg.snow storm) to proactive (a planned trial in response to a known need).
What is staff capability, opportunity and motivation for experimentation?
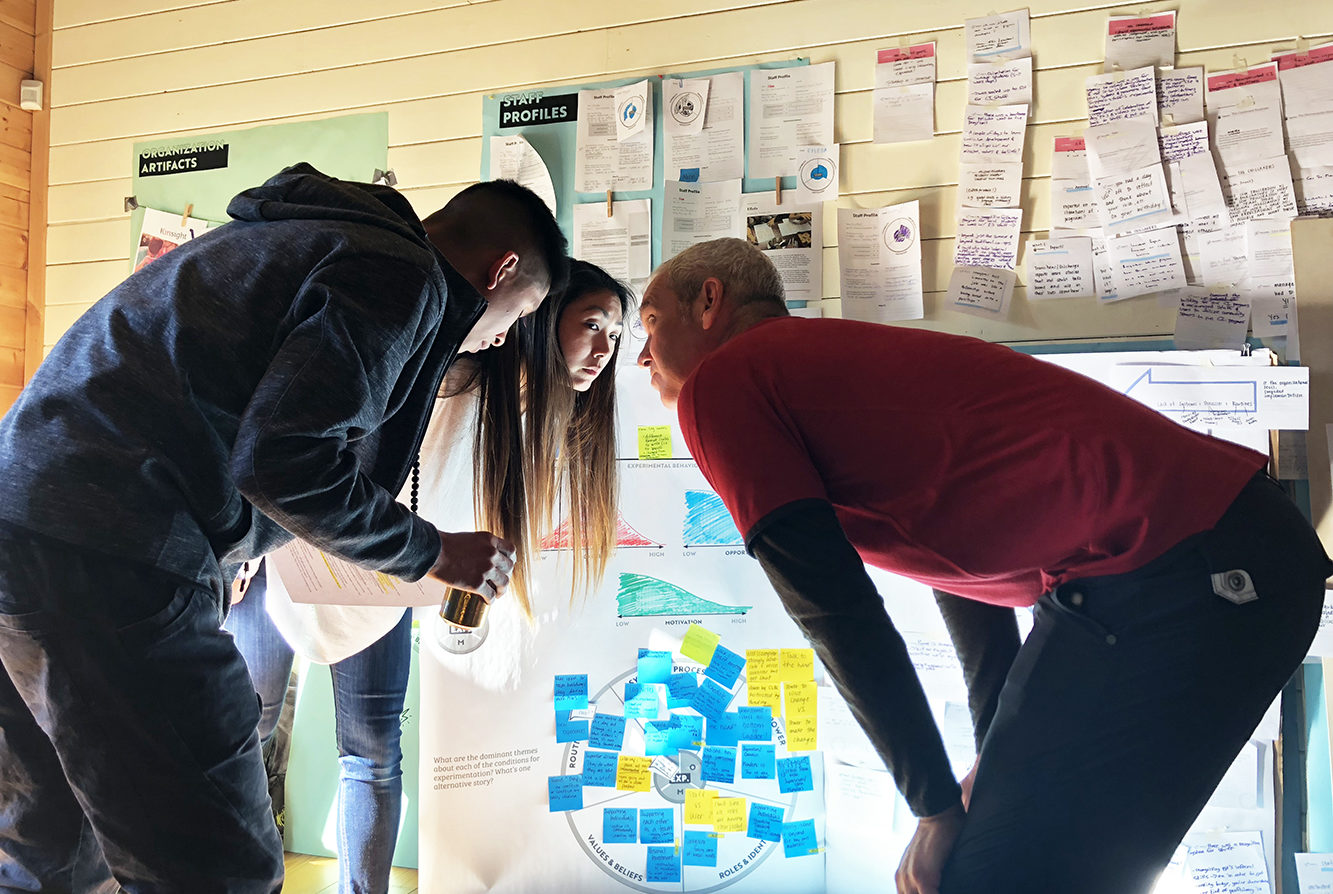
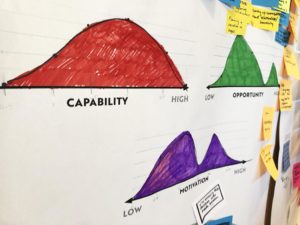
Not only are we building teams’ design muscles, we’re also building their social science muscles. To probe what might be enabling or dis-enabling experimental behaviour, we’ve adapted a behaviour change framework by Dr. Susan Mitchie. This framework says that there are three sources of behaviour: opportunity, capability, and motivation. So for each staff member interviewed & shadowed, teams plotted their motivation, capability, and opportunity for experimentation.
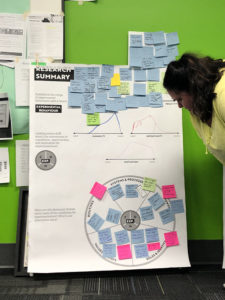
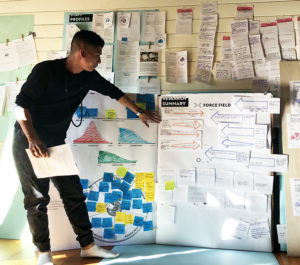
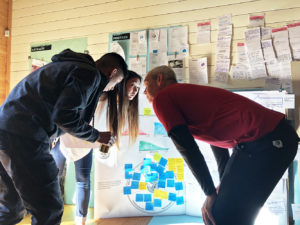
Then, they aggregated the numbers to create a visual distribution. In the image, we see there is mostly medium to high capability for experimentation (in the red modal distribution) but motivation and opportunity to try new things is divided and trends towards the low end of the scale (in purple and green).
What's shaping experimental behaviour?
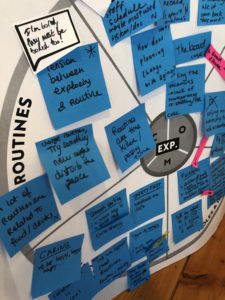
But, what shapes people’s motivation, opportunity, and capability to experiment? One of the ways we’ve adapted Dr. Mitchie’s behavior change framework is by adding 5 conditions that influence opportunity, capability, and motivation: (1) power, (2) systems and processes, (3) roles and identity, (4) values and beliefs, and (5) routines.
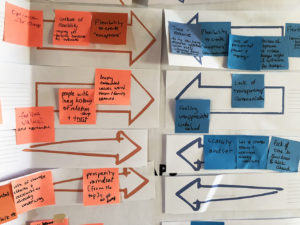
We asked each team to return to their raw data and name the top three narratives around each condition. You can see these dominant narratives on the blue post its. On the pink post its are alternative storylines that are important to pay attention to. For example, when looking at how routines are conceptualized, one of the primary narratives was about passing time and ensuring end users are occupied.
3. Understanding the organizational perspective
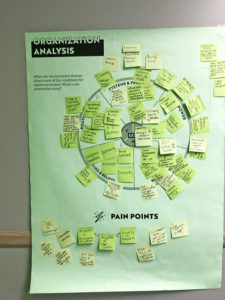
At the same time teams analyzed their bottom-up data, they also analyzed themes from the top-down. They pulled out the dominant stories for each condition as communicated through official artifacts – strategic plans, mission statements, external websites, intranets, staff manuals, etc. For example, one of the organizations found that the only story of power communicated in its official documents was one of hierarchy, as represented through its org chart. There was no other language around this condition.
4. Mind the gaps!
Then teams compared /contrasted the dominant stories shared by staff from those propagated by the organization. They identified and named each gap. For example, with regards to roles and identity, even though one of the organizations talked about learning and innovation as core to the staff experience, few staff brought this up as part of their conceptualization of their role.
5. What is helping or hindering experimentation?
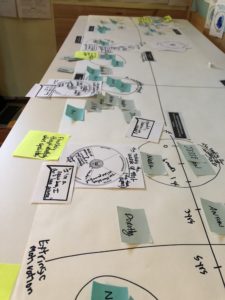
So what? From the pain points, dominant narratives and gaps, teams identified the main forces influencing experimental behaviour and represented them with arrows. The orange arrows are the forces propelling and enabling experimentation and the purple arrows are what is detracting from or standing in the way of experimentation. The bigger the arrow, the stronger the force!
6. Finding the sweet spots
Now that teams had surfaced multiple pain points, segments, and ‘what ifs’ from the three perspectives, plus made visible the gaps between perspectives, they searched for points of overlap: those sweet spots where one ‘what if’ responds to a pain point, gap, or limiting force felt by users, staff and the organization.
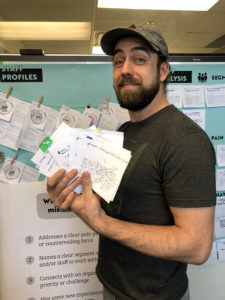
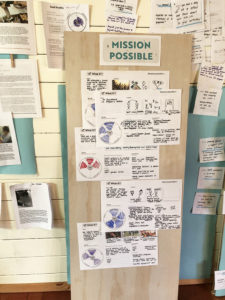
The teams chose between 3 to 6 sweet spots, from which one will be taken into the next Make and Test phase (That’s where teams will learn how to prototype ideas in their every day contexts.) They visualized each sweet spot with three simple drawings, highlighted the relevant pain points and segments, and identified which conditions it mainly impacts.
Feedback & Convergence
Over the next month, each team is sharing findings and ‘what ifs’ back to staff and users within their organizations to garner feedback, hear what rings true and what doesn’t, and converge on one mission to take forward into prototyping!
And that was all in two-days work!
